See the whole operation in one place — live role-based dashboards, branch analytics, and one-click exports across every module.
Everything you need to decide on data
Role-Based Multi-Module Dashboards
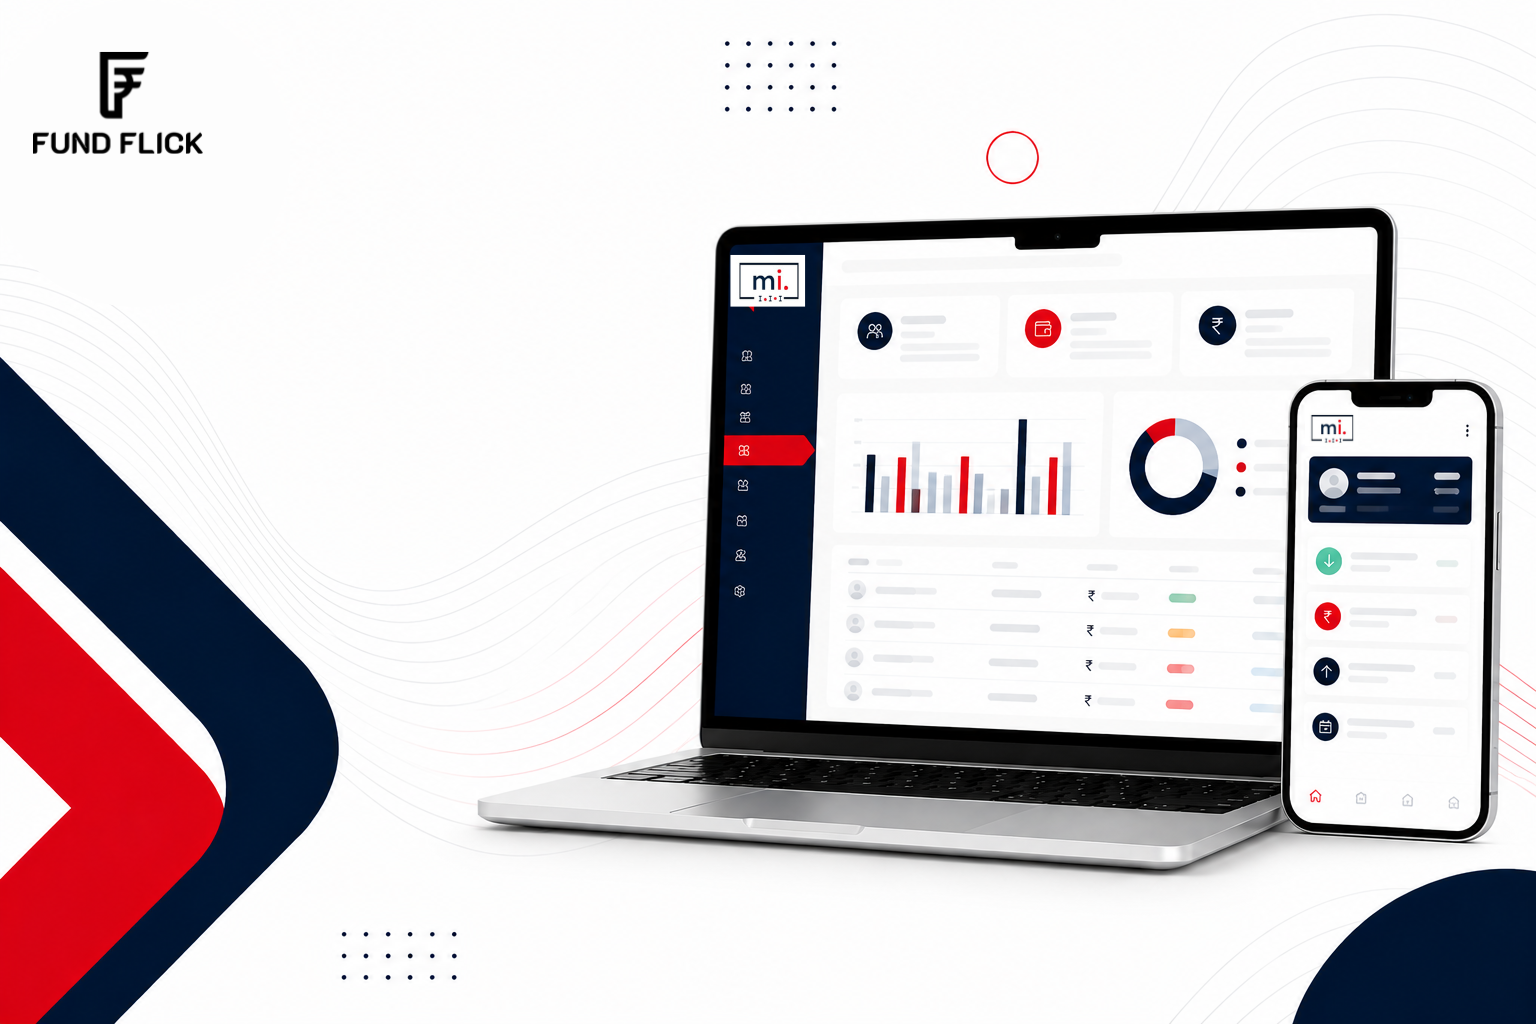
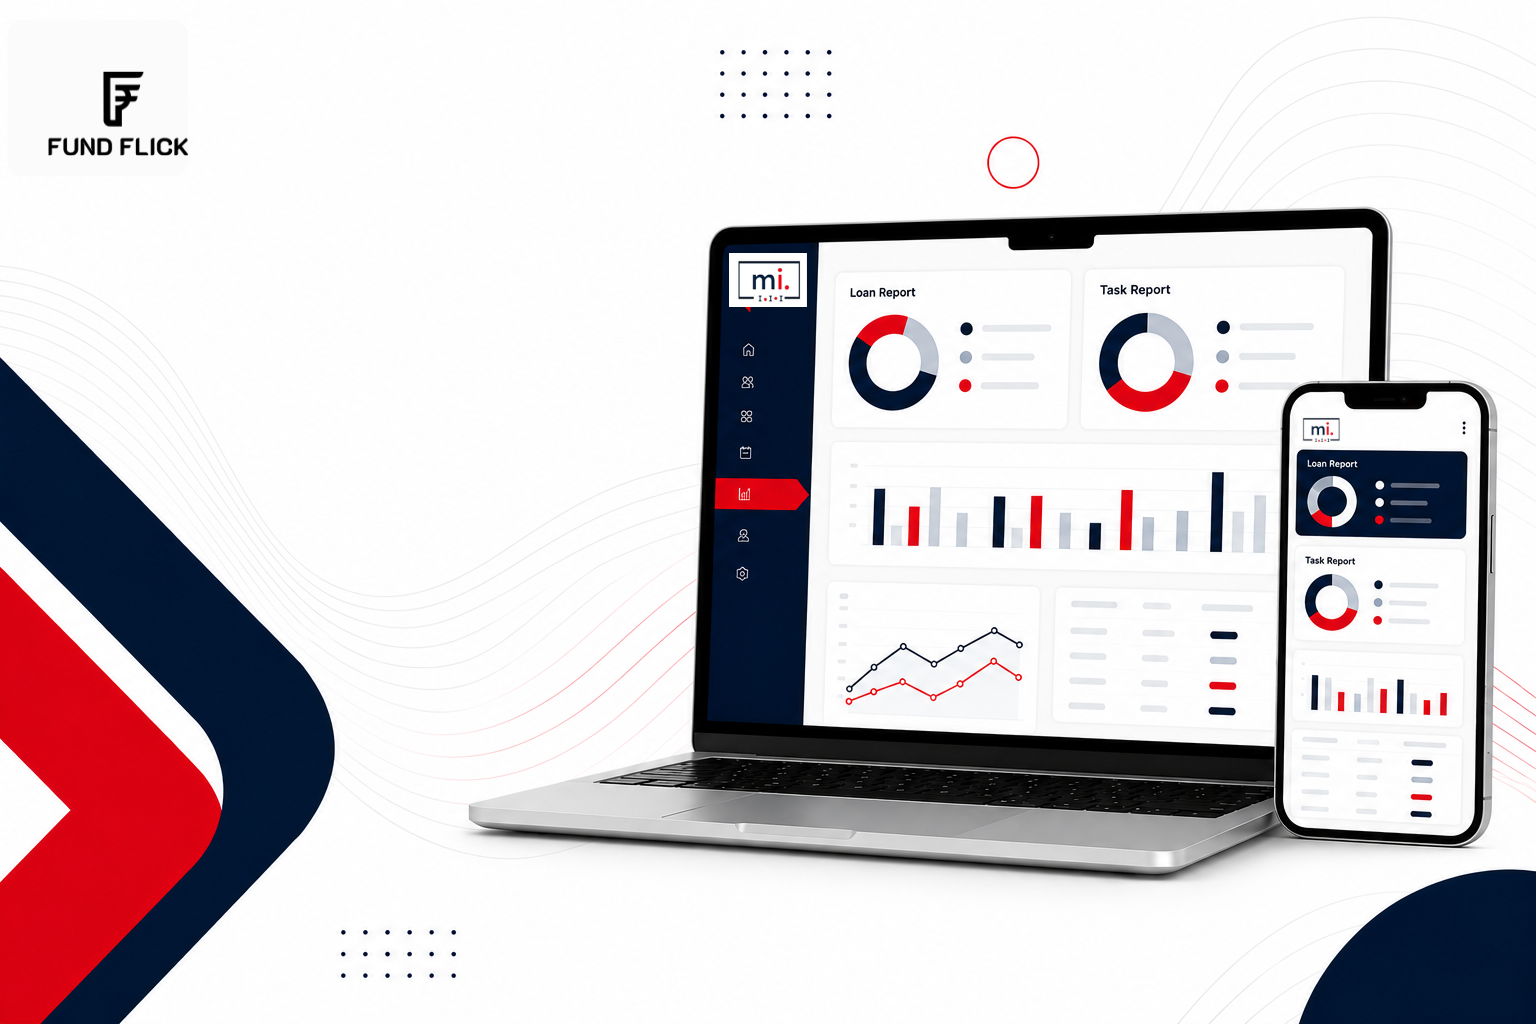
Three dedicated dashboards — LOS (customers, employees, branches, promises, today's collections, due cases), Collection (KPI strip: total cases, pending, collected, today's total, efficiency), and Task (individual & team views). Every KPI card is permission-controlled so each role sees only their data.
Collection Stage & Branch Analytics
Stage-wise case breakdown across Pending PTP, Partially Paid, Expired (broken PTP), and Completed — with percentage and count for each. Branch-wise collection bar chart, loan-type distribution pie chart, PTP count vs Broken PTP count and amount. All powered by MongoDB aggregation pipelines.
Un-Followup Chart (Branch-Wise)
Visual bar chart showing exactly which branches have cases with no follow-up logged this month — broken down by case count per branch. Managers can spot neglected branches at a glance. Export button downloads the full un-followup case list with customer name, overdue amount, address, and due EMI to Excel.
Agent-Level Performance Analytics
Per-agent report: total cases assigned, cases worked, total follow-ups logged, total payments collected, attitude breakdown (Polite / Rude / Medium / No Reply), visit type split (Telecall vs Field Visit), and a daily activity bar chart for the last 15 days. Case efficiency score (manual and branch performance) calculated per agent.
CSV & Excel Export Across Modules
Every key report has a download button: Stock Report (CSV, branch-filtered), Collection payment receipts (CSV), Daily follow-ups (Excel with area, case, customer, overdue, EMI), Client Ledger (XLSX with two sheets — Ledger and Timeline), and Un-followup report (Excel). Bulk case upload via CSV/XLSX is also supported.
Cross-Module Reports Hub
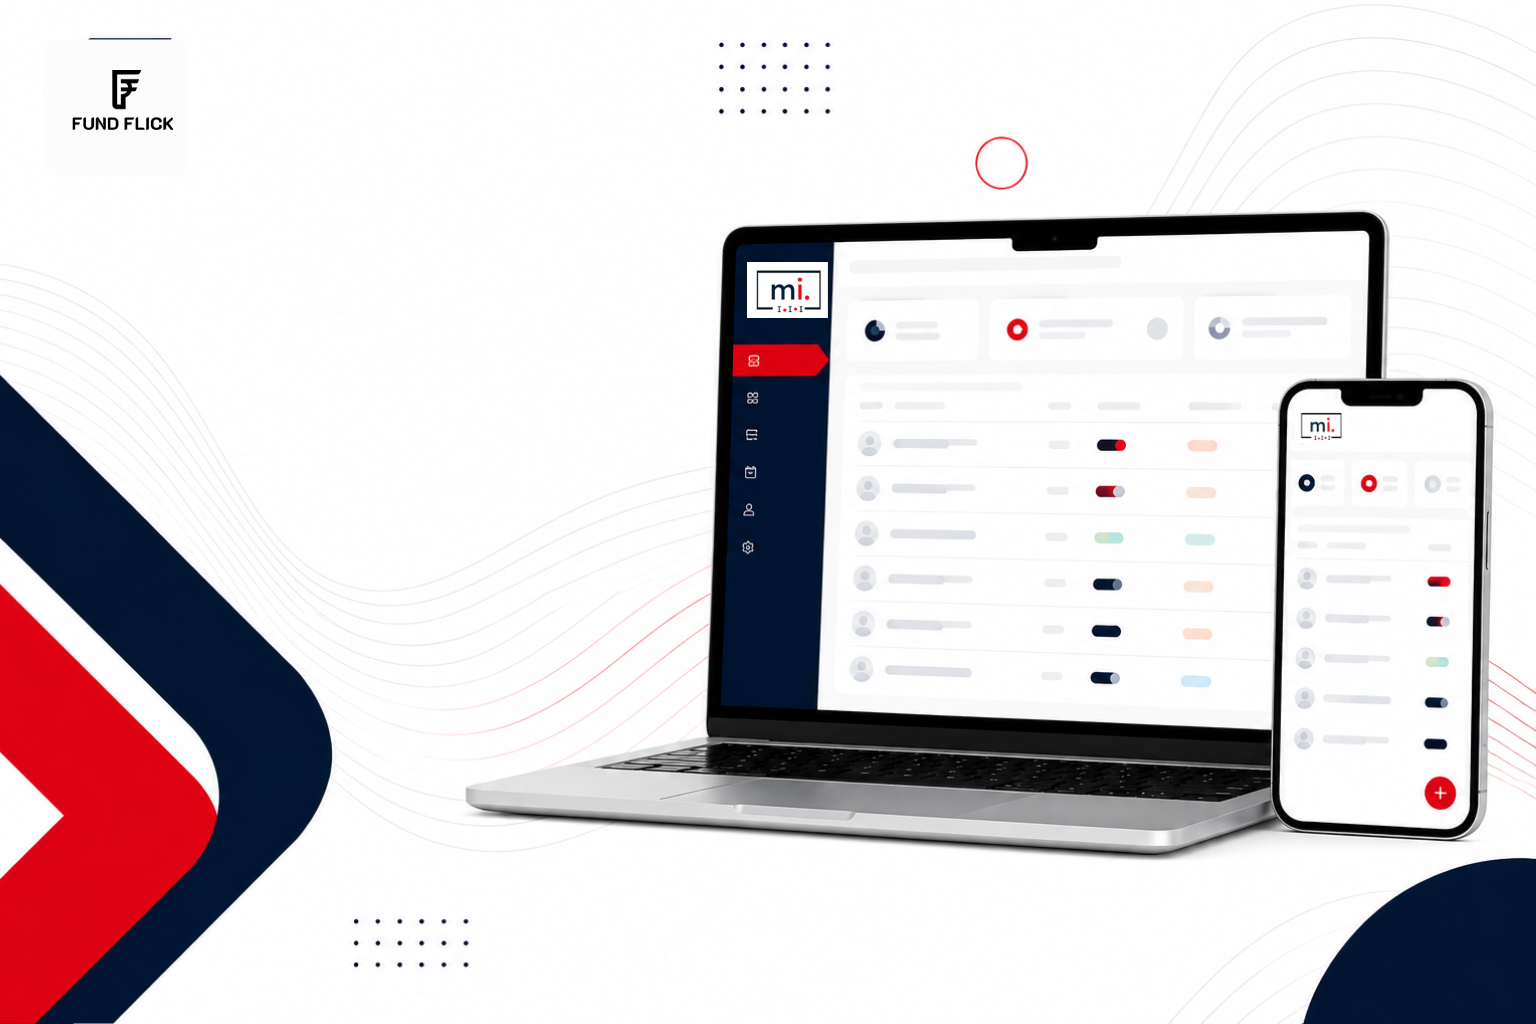
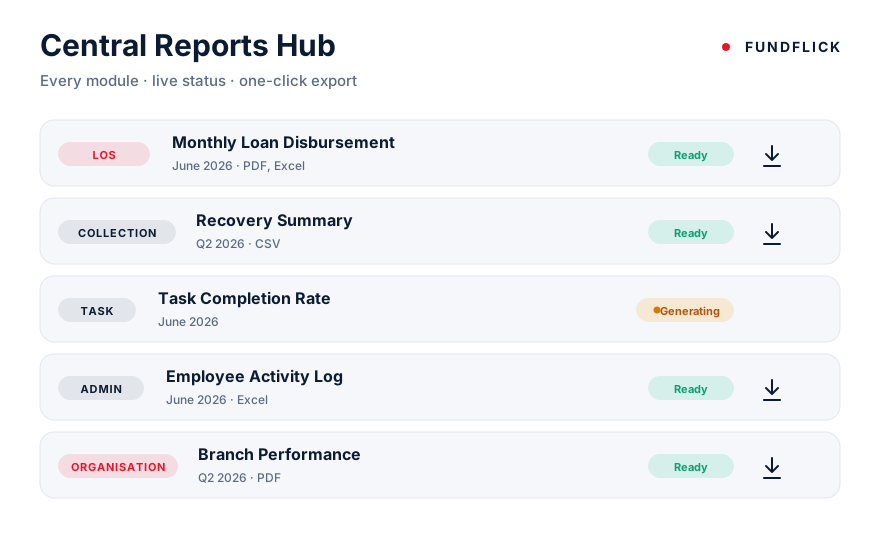
A central Reports page lists all generated reports by module — Monthly Loan Disbursement (LOS), Collection Recovery Summary, Branch Performance Overview (Organisation), Employee Activity Log (Admin), and Task Completion Rate (Task). Each report shows its category, period, and a Ready or Generating status badge.
Numbers don't lie. We make them speak.
Cross-module reporting — collection, LMS, LOS, tasks and agents, all in one place
Every Report, Across Every Module, in One Place
The Central Reports Hub gives managers and admins a single destination for all generated reports — spanning LOS, Collection, Task Management, Admin, and Organisation — with live status and one-click download.
Got a Question?
Everything you need to know about Smart Reports and Analytics.
There are three role-based dashboards: LOS (customers, employees, branches, promises, today's collections, due cases), Collection (total cases, pending, collected, today's total, efficiency), and Task (individual and team views). Each KPI card is permission-controlled so every role sees only their data.
Collection reporting covers stage-wise case breakdown across Pending PTP, Partially Paid, Expired (broken PTP), and Completed, plus a branch-wise collection bar chart, loan-type distribution pie chart, and PTP versus broken-PTP counts and amounts.
A branch-wise bar chart shows which branches have cases with no follow-up logged this month, broken down by case count per branch. You can export the full un-followup list with customer name, overdue amount, address, and due EMI to Excel.
Each agent gets a scorecard with cases assigned and worked, follow-ups logged, payments collected, attitude and visit-type splits, a 15-day daily activity chart, and a case efficiency score.
Exports are CSV and Excel only. Stock reports and collection receipts export to CSV, daily follow-ups and the un-followup list export to Excel, and the Client Ledger exports to XLSX with separate Ledger and Timeline sheets.
The Cross-Module Reports Hub lists every generated report by module, including Loan Disbursement, Collection Recovery, Branch Performance, Employee Activity, and Task Completion, each with its category, period, and a Ready or Generating status badge.
Run your book on real numbers
See live NPA, yield, and collection analytics for your portfolio in a working dashboard.
Request a demo